Note
Go to the end to download the full example code.
Heating only the Electrons with One Triangular Event#
In this example, only the electrons are heated by a single triangular pulse lasting 500 seconds and injecting 10 ergs per cubic centimeter into the loop plasma.
import astropy.units as u
import matplotlib.pyplot as plt
import numpy as np

from astropy.visualization import quantity_support

import ebtelplusplus

from ebtelplusplus.models import DemModel, HeatingModel, TriangularHeatingEvent

quantity_support()
<astropy.visualization.units.quantity_support.<locals>.MplQuantityConverter object at 0x71408a1d77a0>
Set up a single heating event that is triangular in shape such that it rises linearly for 250 s and then falls linearly for 250 s starting at the beginning of the simulation (0 s).
Let’s add this to a heating model in which we partition all of the energy into the electrons
heating = HeatingModel(background=3.5e-5*u.Unit('erg cm-3 s-1'),
                       partition=1.0,
                       events=[event])
Now run the simulation for a 40 Mm loop lasting a total of 5000 s. We’ll also specify that we want to compute the DEM
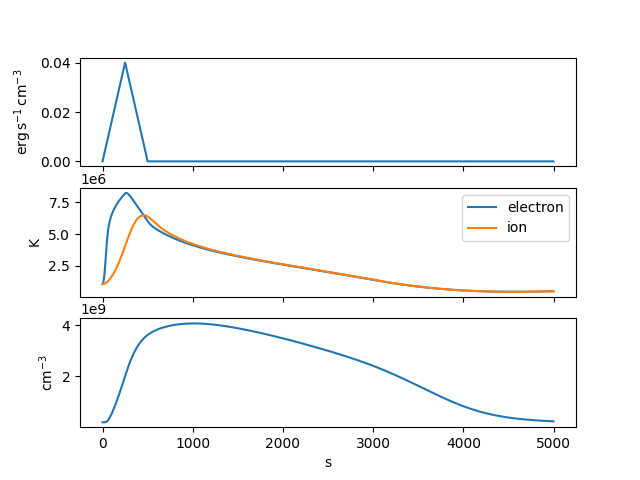
Let’s visualize the heating profile, temperature, and density as a function of time.
fig, axes = plt.subplots(3, 1, sharex=True)
axes[0].plot(result.time, result.heat)
axes[1].plot(result.time, result.electron_temperature, label='electron')
axes[1].plot(result.time, result.ion_temperature, label='ion')
axes[2].plot(result.time, result.density)
axes[1].legend()
<matplotlib.legend.Legend object at 0x71408a441f70>
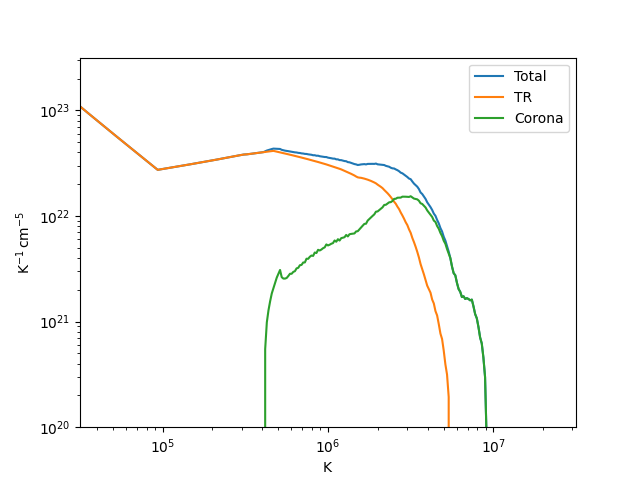
Finally, let’s visualize the DEM distribution. We’ll first time-average each component over the duration of the simulation.
delta_t = np.gradient(result.time)
dem_avg_total = np.average(result.dem_tr+result.dem_corona,
                           axis=0,
                           weights=delta_t)
dem_avg_tr = np.average(result.dem_tr,
                        axis=0,
                        weights=delta_t)
dem_avg_corona = np.average(result.dem_corona,
                            axis=0,
                            weights=delta_t)
And now we can plot each component
fig = plt.figure()
ax = fig.add_subplot()
ax.plot(result.dem_temperature, dem_avg_total, label='Total')
ax.plot(result.dem_temperature, dem_avg_tr, label='TR')
ax.plot(result.dem_temperature, dem_avg_corona, label='Corona')
ax.set_xlim([10**(4.5), 10**(7.5)]*u.K)
ax.set_ylim([10**(20.0), 10**(23.5)]*u.Unit('cm-5 K-1'))
ax.set_xscale('log')
ax.set_yscale('log')
ax.legend()

plt.show()
Total running time of the script: (0 minutes 0.403 seconds)